Updated
Hormuz Tracker
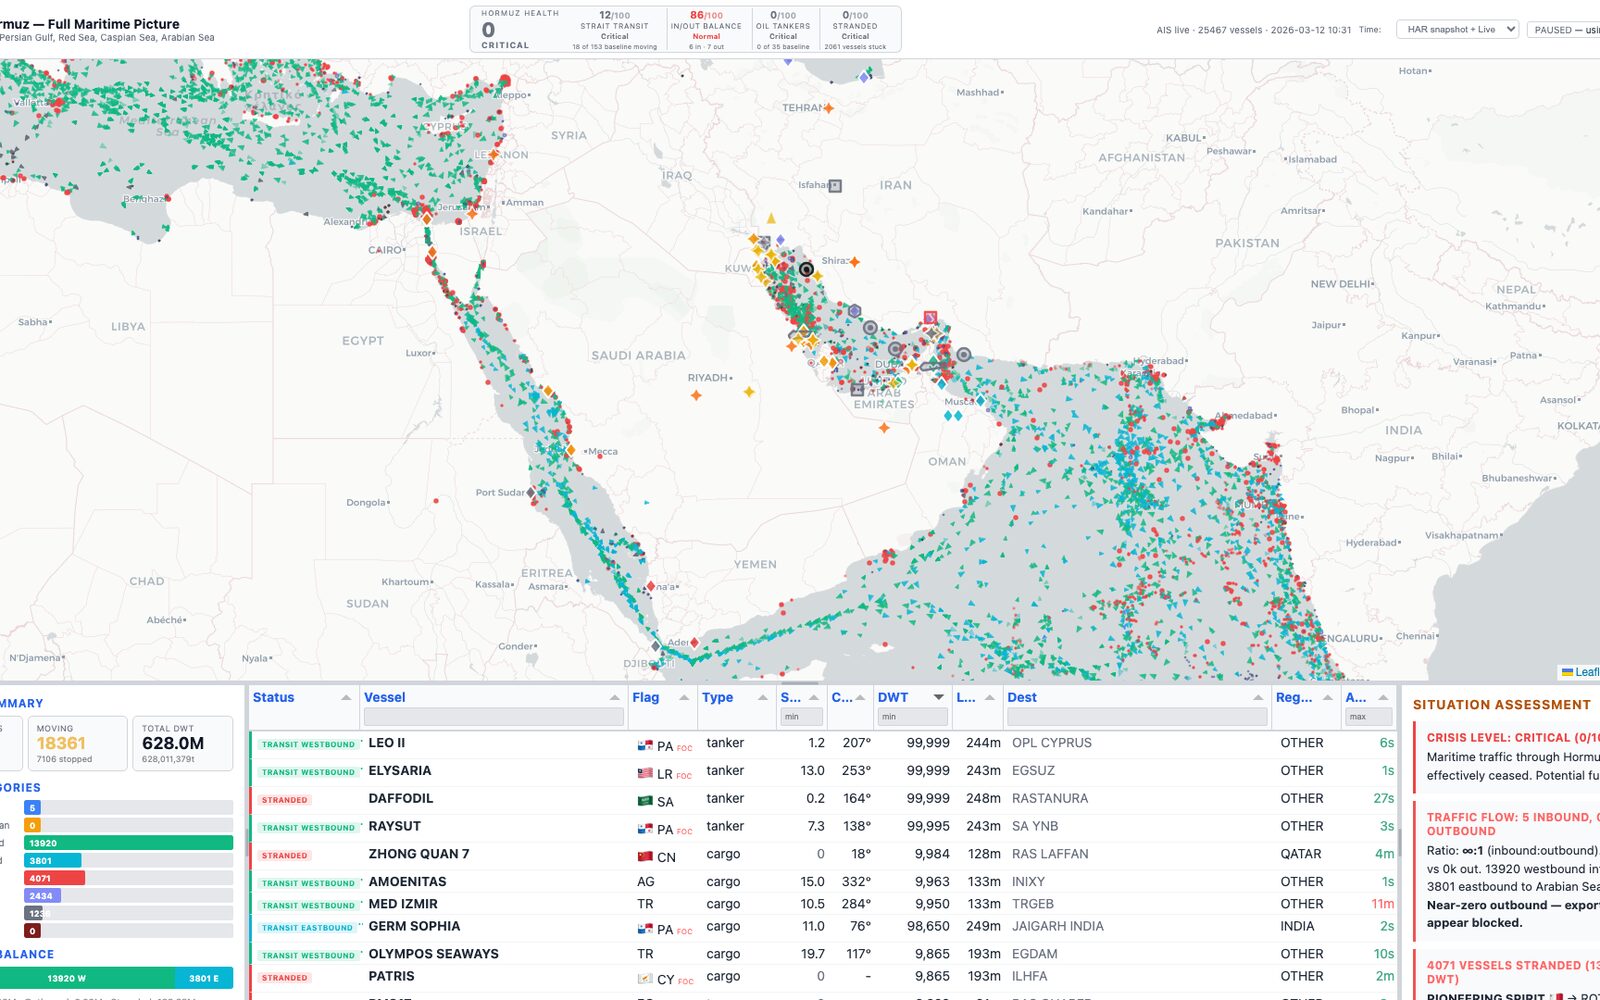
The 2026 Strait of Hormuz crisis on one map: 25,000 ships, the events around them and the supply chains behind them.
Status: A snapshot of a fast-moving situation, built from captured and scraped data in March 2026. The numbers describe that moment, not today.
What it is
A dashboard built in March 2026, as shipping through the Strait of Hormuz stopped. It plots more than 25,000 vessel positions across the Persian Gulf, the Red Sea and the Caspian Sea, sorts every ship into inbound, outbound, transiting, stranded, idle or dark, and rolls it all into a crisis score from 0 to 100.
On 12 March 2026 the score read 0 of 100, critical: no tankers were transiting the strait and 2,061 vessels were stranded. Countdowns show how many days remain before fertilizer, Gulf food imports, LNG and chip supply chains hit a critical shortage.
How it works
- Vessel positions come from captured MarineTraffic AIS data, with optional live positions from AISStream. Markers are drawn on a canvas layer so 25,000 ships stay smooth on a Leaflet map.
- Clicking a ship draws a line to its destination port; clicking one of 32 ports shows every ship headed there, split into headed and stranded.
- Adapters collect conflict events from liveuamap, iranwarlive and Wikipedia, news from BBC and Al Jazeera, and posts from five OSINT subreddits. Strikes and sightings fade from red to gray with age.
- Twenty-five oil terminals, refineries, gas plants and pipelines carry a status from operational to destroyed, including the bypass pipelines that still flow.
- A Tabulator table with sort, filter and group-by stays in sync with the map viewport. The scoring and parsing logic has 234 tests.
Built with
Started