Updated
audioscopia
A live spectrogram of your microphone, drawn on the GPU.
What it is
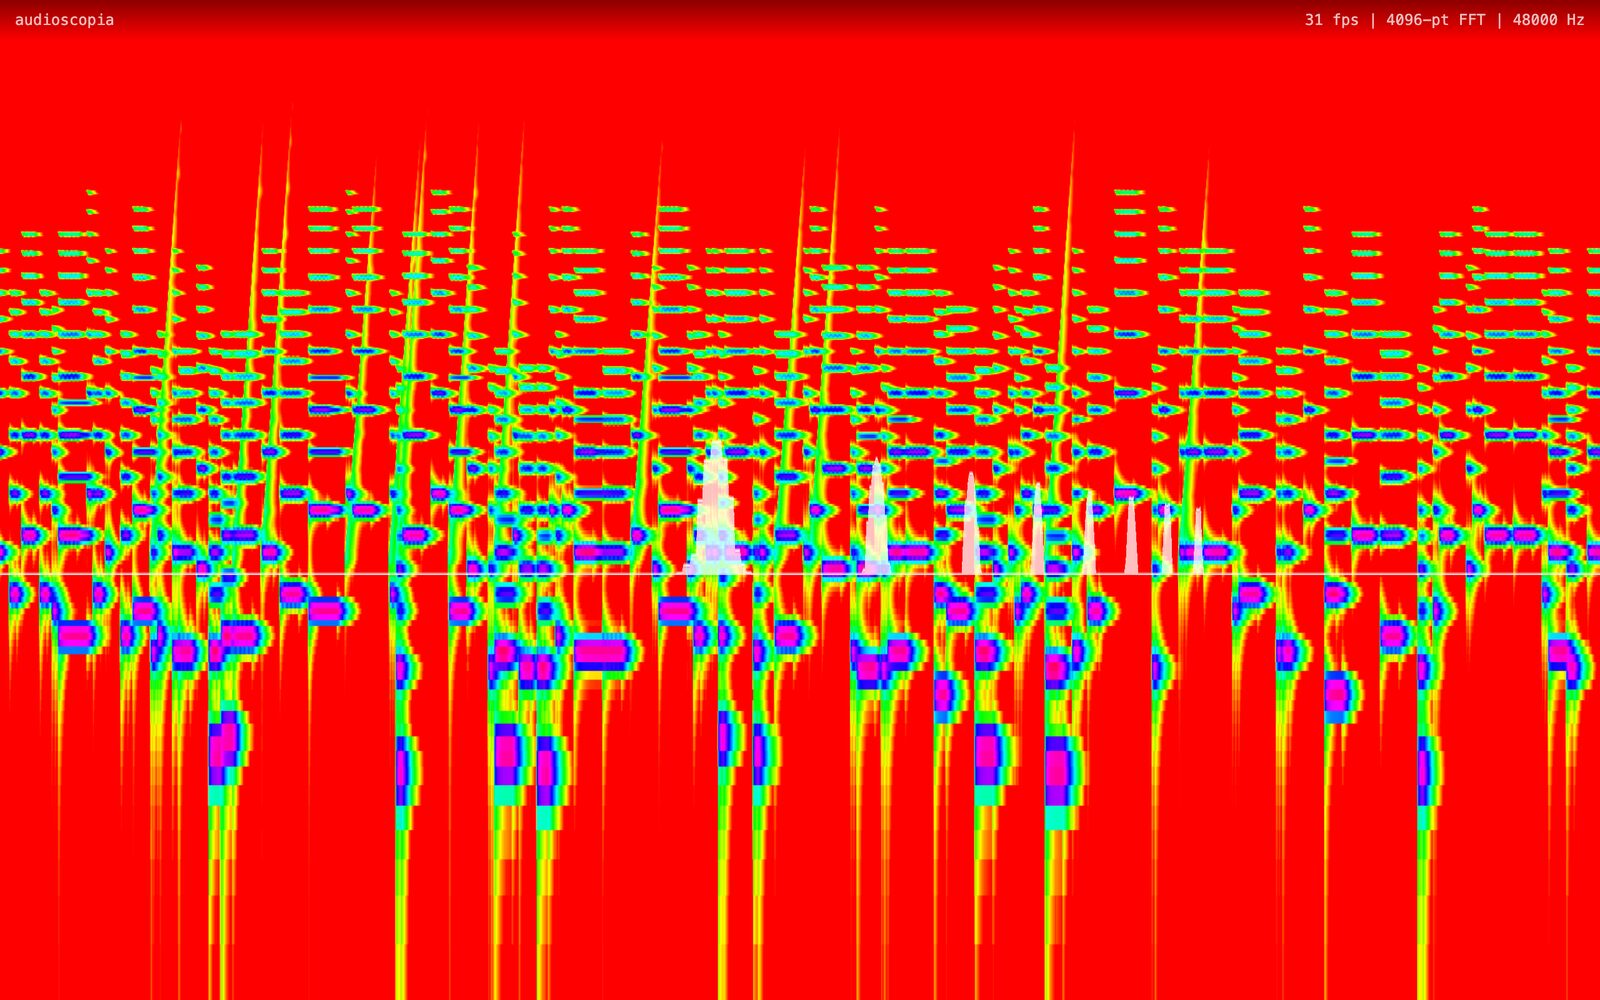
Tap to start, allow the microphone, and watch sound scroll past: a spectrogram from 20 Hz to 20 kHz on a logarithmic scale, red where it is quiet, shifting through yellow, green and blue to magenta as it gets louder, with the live frequency curve across the middle.
It is two static files and no server, and it stays smooth by keeping all the pixel work on the graphics card.
How it works
- Microphone audio runs through a gain node into an analyser with a 4096-point FFT.
- A 2048 × 1024 texture acts as a circular buffer. Each frame writes one new column of log-frequency data, colored by intensity.
- A fragment shader scrolls the texture by an offset uniform, so the newest column is always at the right edge and no pixels are copied on the CPU.
- A second shader draws the live frequency curve as a filled, glowing line across the middle of the screen.
- A small display at the top shows frame rate, FFT size and sample rate.
Built with
Started